
Welcome to the ONFANT App
ONFANT, ON-FArm Nitrogen Trials, is a web-based interactive tool to visualize and summarize historical on-farm replicated strip trial data conducted by farmers working with the Iowa Soybean Association (see tab “Replicated strip trials”) and guided corn nitrate survey fields data across the Midwest (see tab “corn stalk N surveys”).
ONFANT uses data from a data repository developed for the project “FACT: web-based dynamic data-analytics framework for on-farm research networks”. The main goals of this project are:
- to develop a data repository to combine, prepare, protect, and share data
- to create a data analytics framework to analyze and communicate results
- to design a dynamic online tool to display multi-location statistical analyses and to inform N management decisions.
ONFANT has a friendly user interface that includes summarization and filtering features such as the ability to select data from state, unit, previous crop, and date range.
The data repository can be found and downloaded here.
Data provided by USDA-NRCS and funding received by USDA NIFA

Instructions
Noise for all the field coordinates was added for privacy purposes.
Description of the late-season corn stalk nitrate test
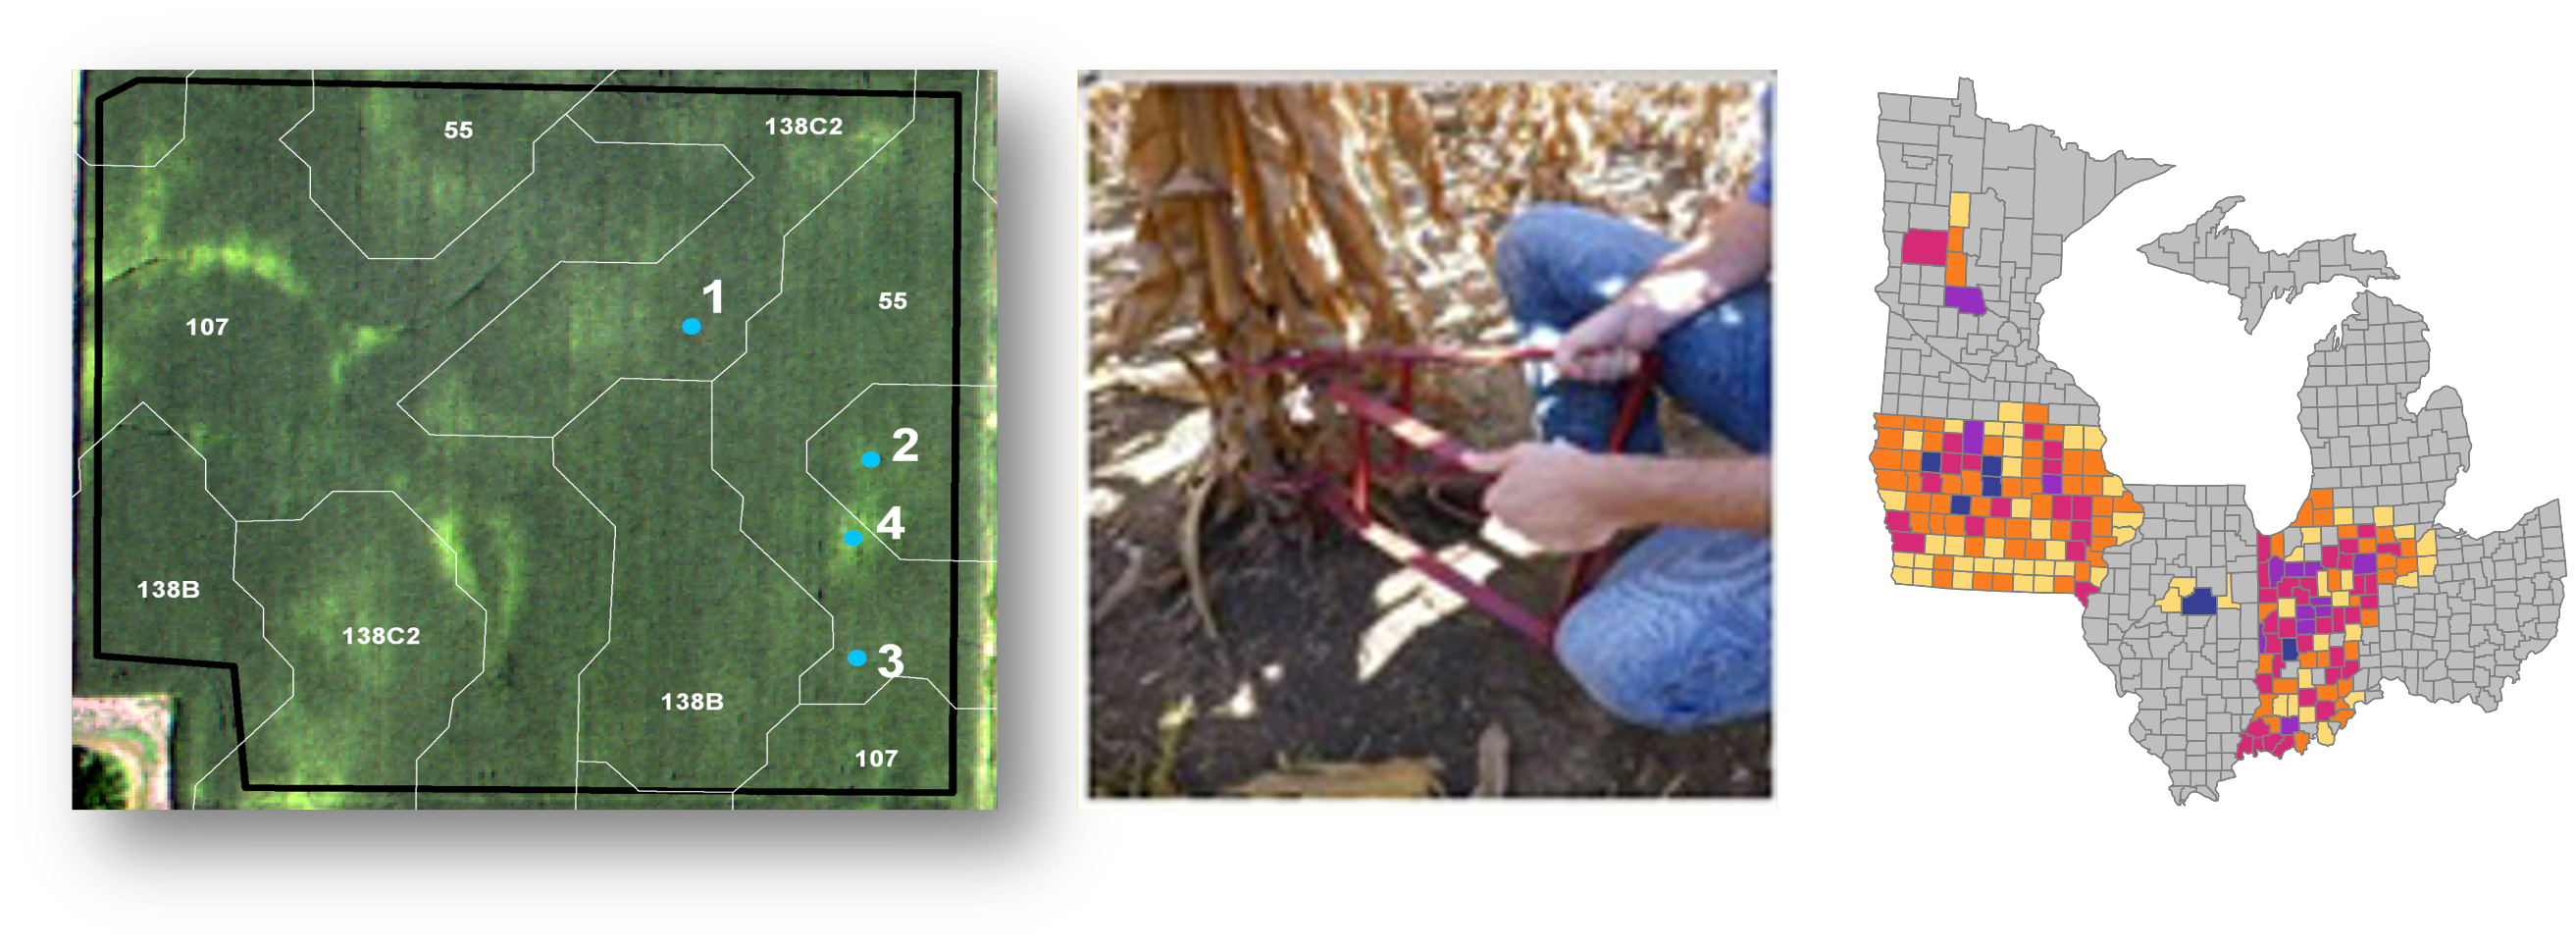
Observations of late-season corn N status were collected using the late-season corn stalk nitrate test (CSNT) and were guided by digital aerial imagery of the corn canopy. Three corn stalk samples were collected within three predominant soil types (based on their area within the fields) to characterize the field-average N status.
Stalk samples were collected (in the 20.3 to 35.6 cm (8–14 inch), above-ground portion of cornstalks) from two to five weeks after corn grain reached physiological maturity or black layer stage.
Description of the N sufficiency levels
The CSNT results are categorized into four N sufficiency levels:
- deficient (<250 mg/kg)
- marginal (250–700 mg/kg)
- optimal (700–2000 mg/kg)
- excessive (>2000 mg/kg)
Weather data collection
The weather data come from Iowa Mesonet and extracted using the R package apsimx.
The tabs below summarize the weather data (rainfall, temperature, and radiation) by year and state. You can access to the daily observations per corn field by downloading our R package onfant.
The reference rainfall, temperature and growing degree day (indicated by a black line) were averaged per state over the years the corn fields harvested. Source: Iowa Mesonet.
Monthly temperature
Note: The reference temperature is indicated by the black line.Cumulative Growing Degree Day
Note: The reference GDD is indicated by the black line.Radiation
Note: The reference radiation is indicated by a black line.Nitrogen rate distribution per N form
Note: NH3 = Anhydrous ammonia ; UAN = Urea Ammonium NitrateNitrogen rate distribution over time across N form
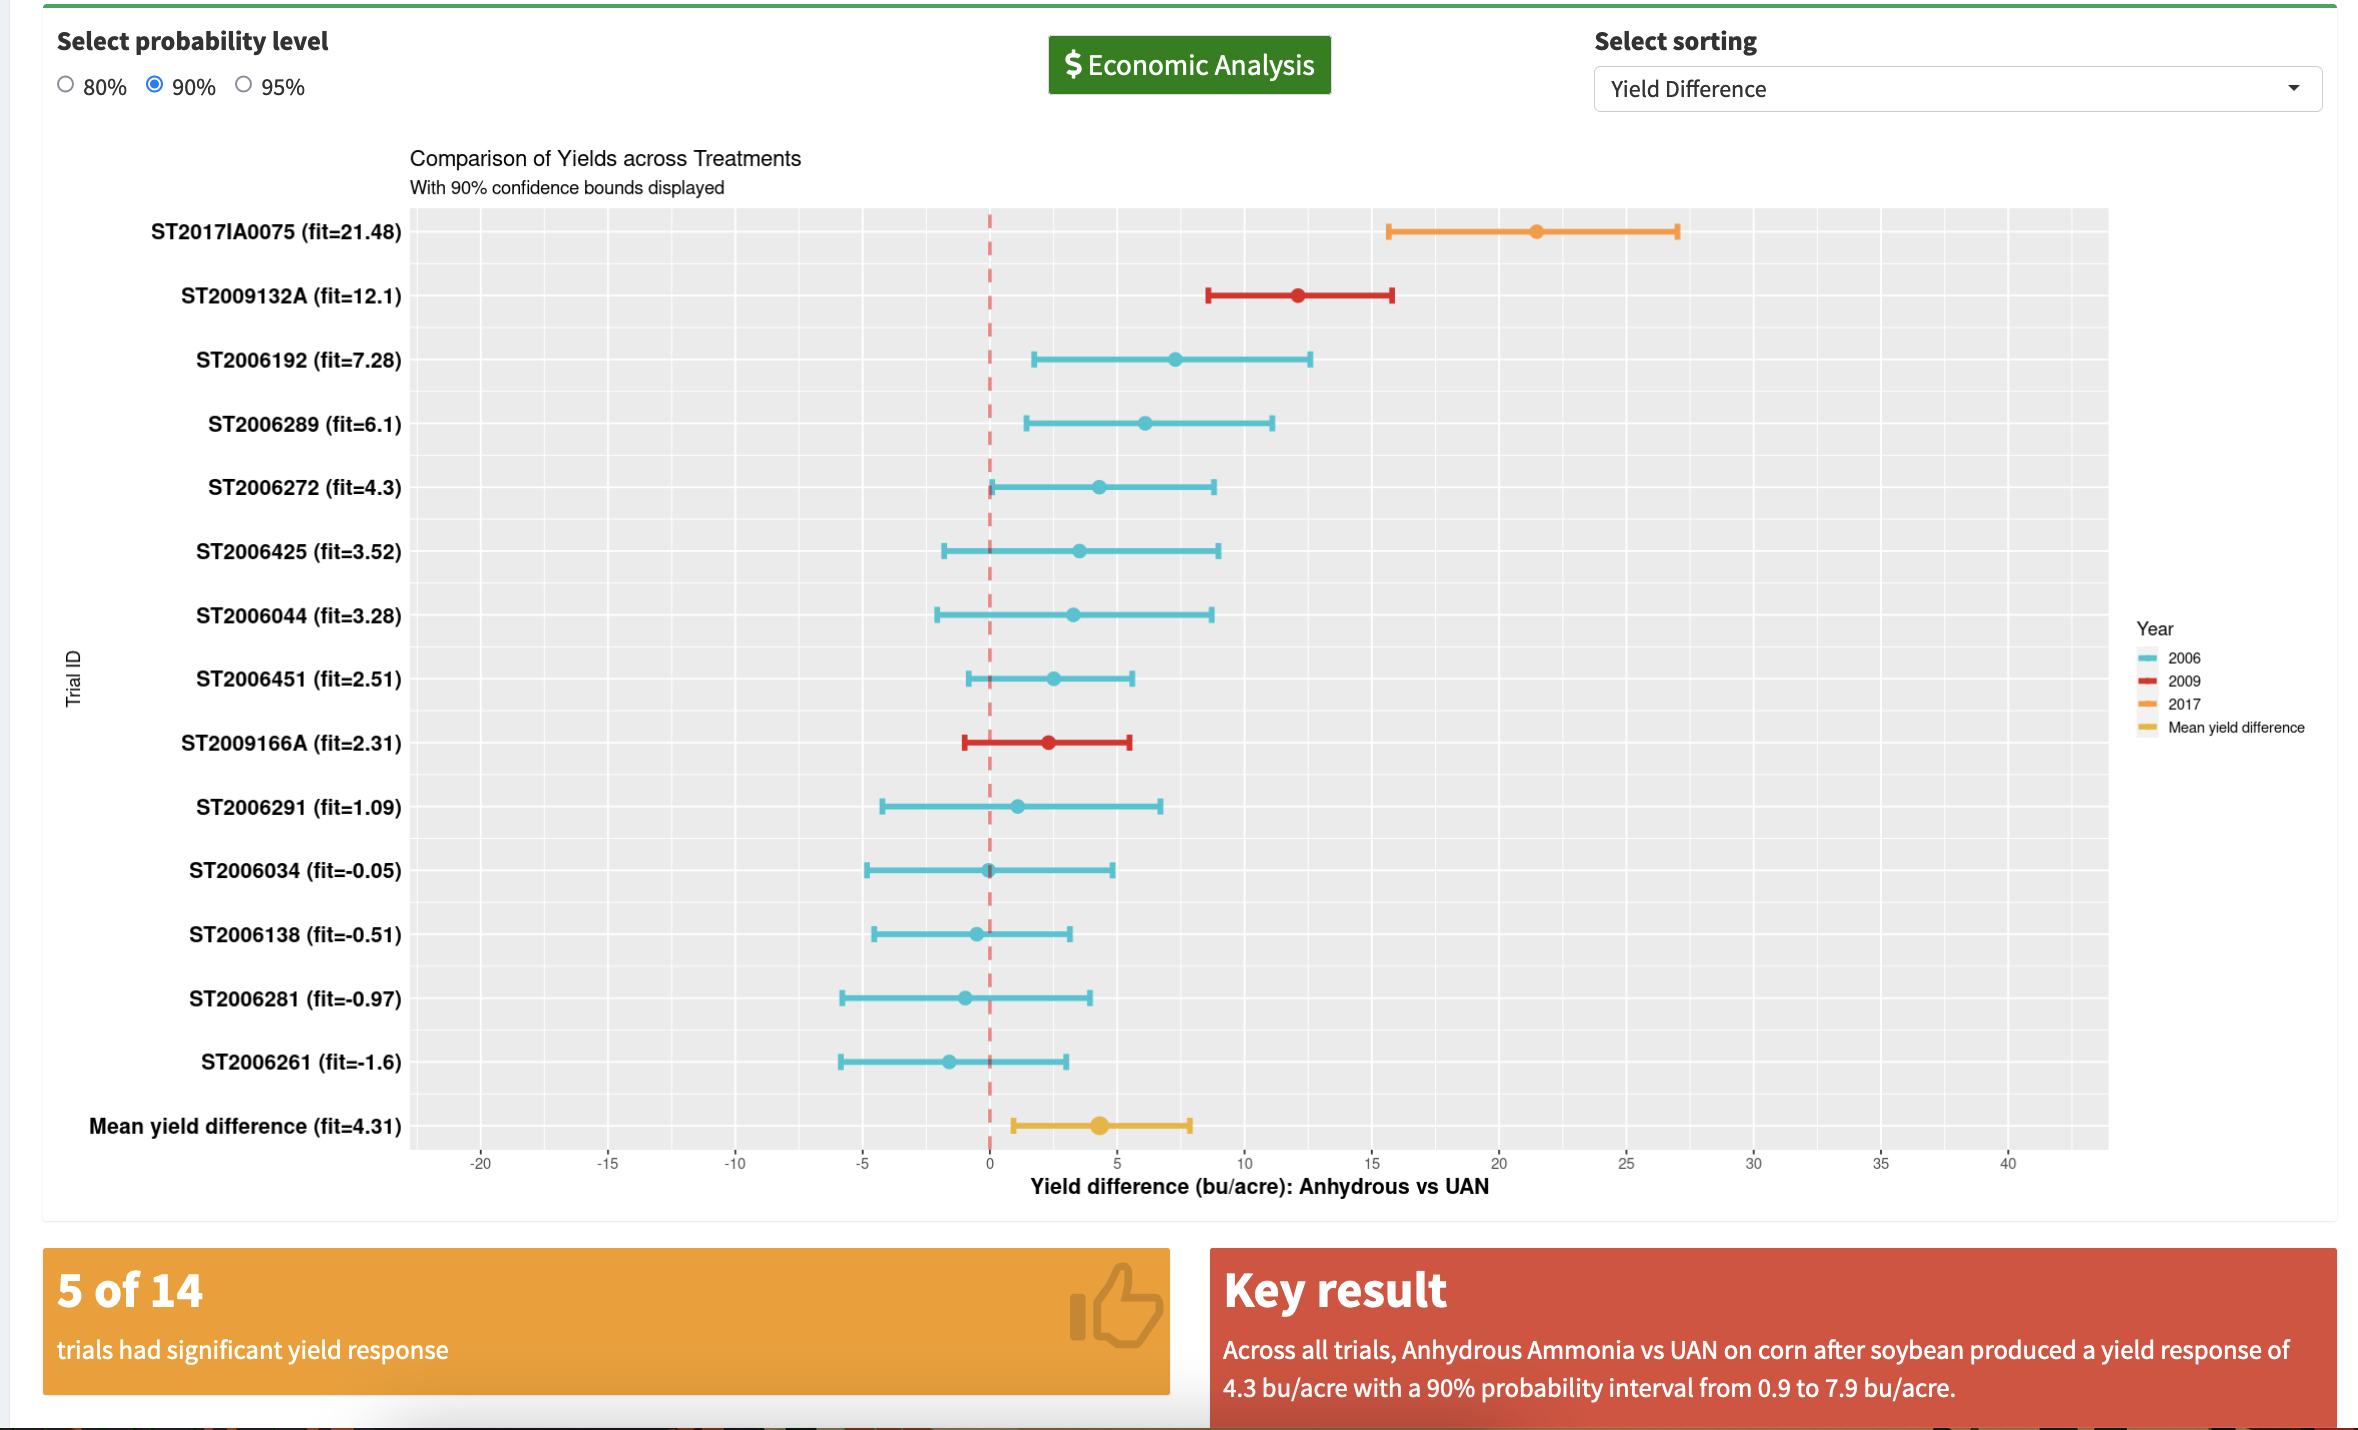
Observed N rate required to reach a specific corn N status for different combination of N form and timing of application
Note: NH3 = Anhydrous ammonia ; UAN = Urea Ammonium NitrateComplete instructions 1/2/3 from the left sidebar panel.
Percentage of corn N status per type of N management
Complete instructions 2 and 3 from the left sidebar panel.Percentage of corn N status per Year
Complete instruction 2 from the left sidebar panel.Previous publications
Part of the data have been published in the following peer-reviewed papers:
Anderson C and Kyveryga P (2016). Combining on-farm and climate data for risk management of nitrogen decisions. Climate Risk Management. DOI: 10.1016/j.crm.2016.03.002
Kyveryga P et al. (2012). Normalization of uncalibrated late-season digital aerial imagery for evaluating corn nitrogen status. Precision Agriculture. DOI: 10.1007/s11119-011-9231-8
Kyveryga P et al. (2011). Late-season digital aerial imagery and stalk nitrate testing to estimate the percentage of areas with different nitrogen status within fields. Journal of soil and water conservation. DOI: 10.2489/jswc.66.6.373
Tao H et al. (2018). Factors affecting nitrogen availability and variability in cornfields. Agronomy Journal. DOI: 10.2134/agronj2017.11.0631
Kyveryga et al. (2010). Identification of nitrogen management categories by corn stalk nitrate sampling guided by aerial imagery. Agronomy Journal. DOI: 10.2134/agronj2009.0401
Visit our other web-application EVOS
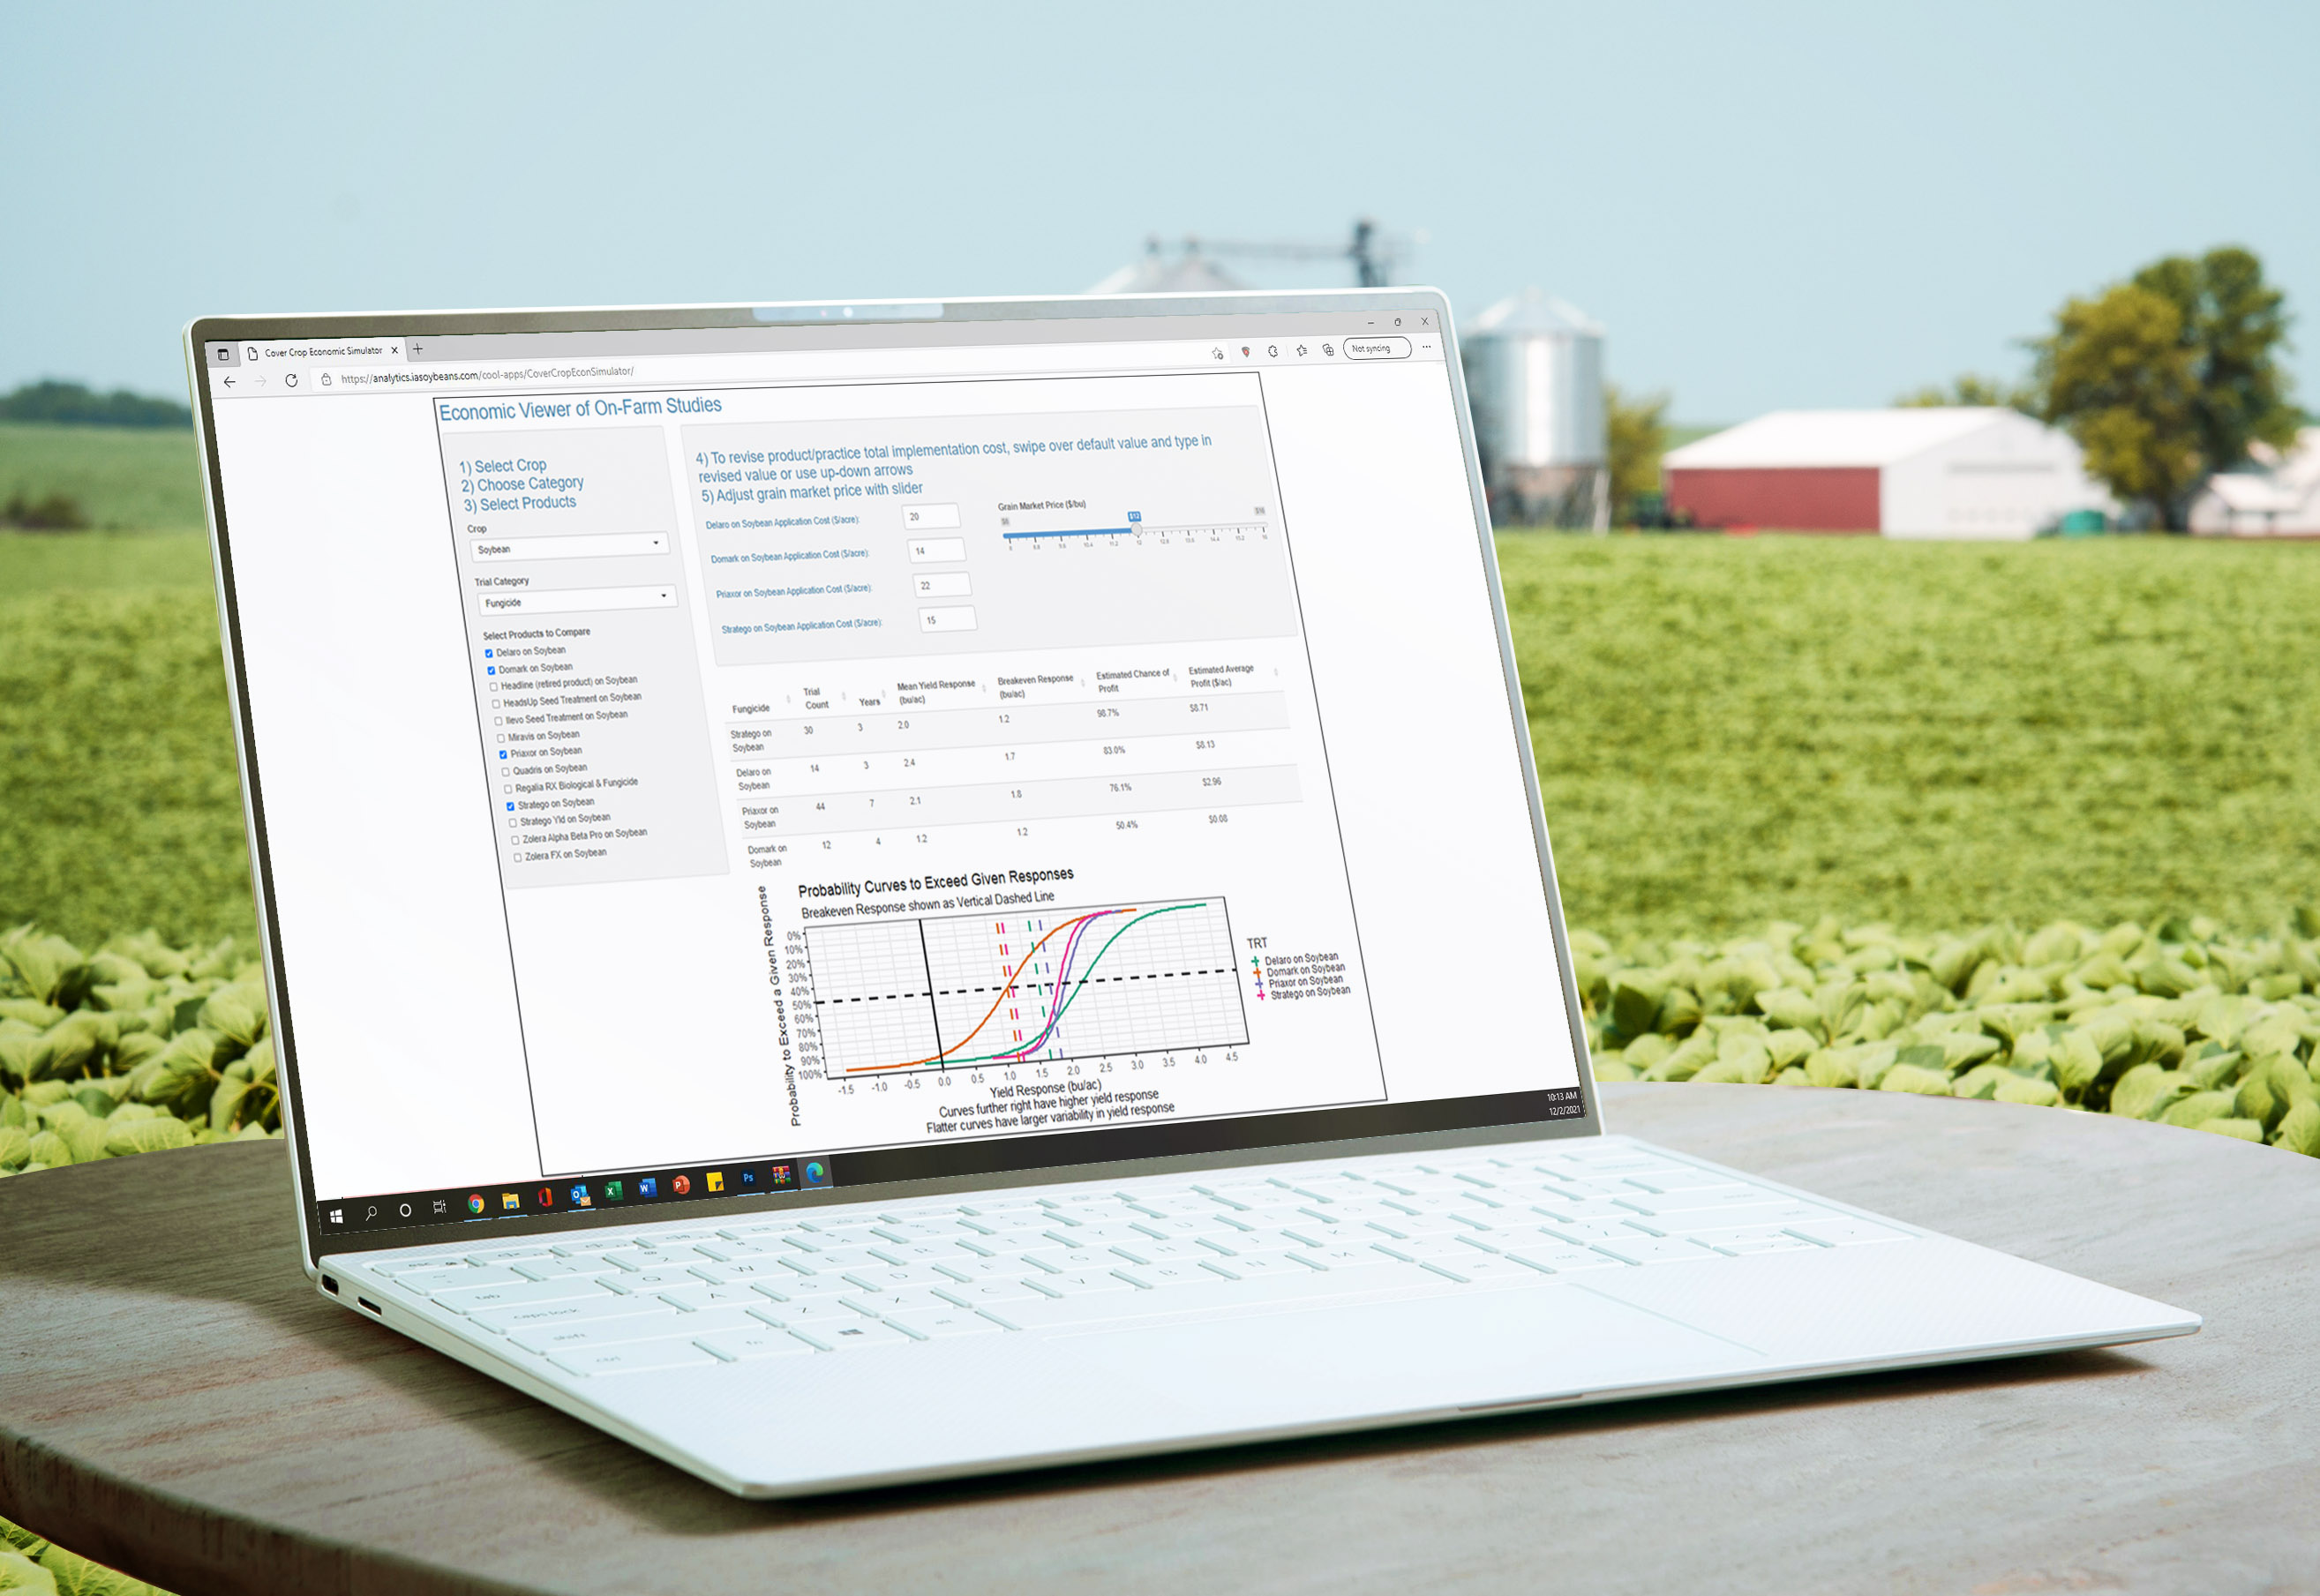
(Photo/Iowa Soybean Association)
EVOS, Economic Viewer of On-Farm Studies, is decision-aid tool that helps farmers make economic assessments.
It was developed by the Iowa Soybean Association's Research Center for Farming Innovation's analytics team.
For any information, please send an email to Peter Kyveryga @ pkyveryga@iasoybeans.com or Suzanne Fey @ sfey@iasoybeans.com
To visit EVOS click here!
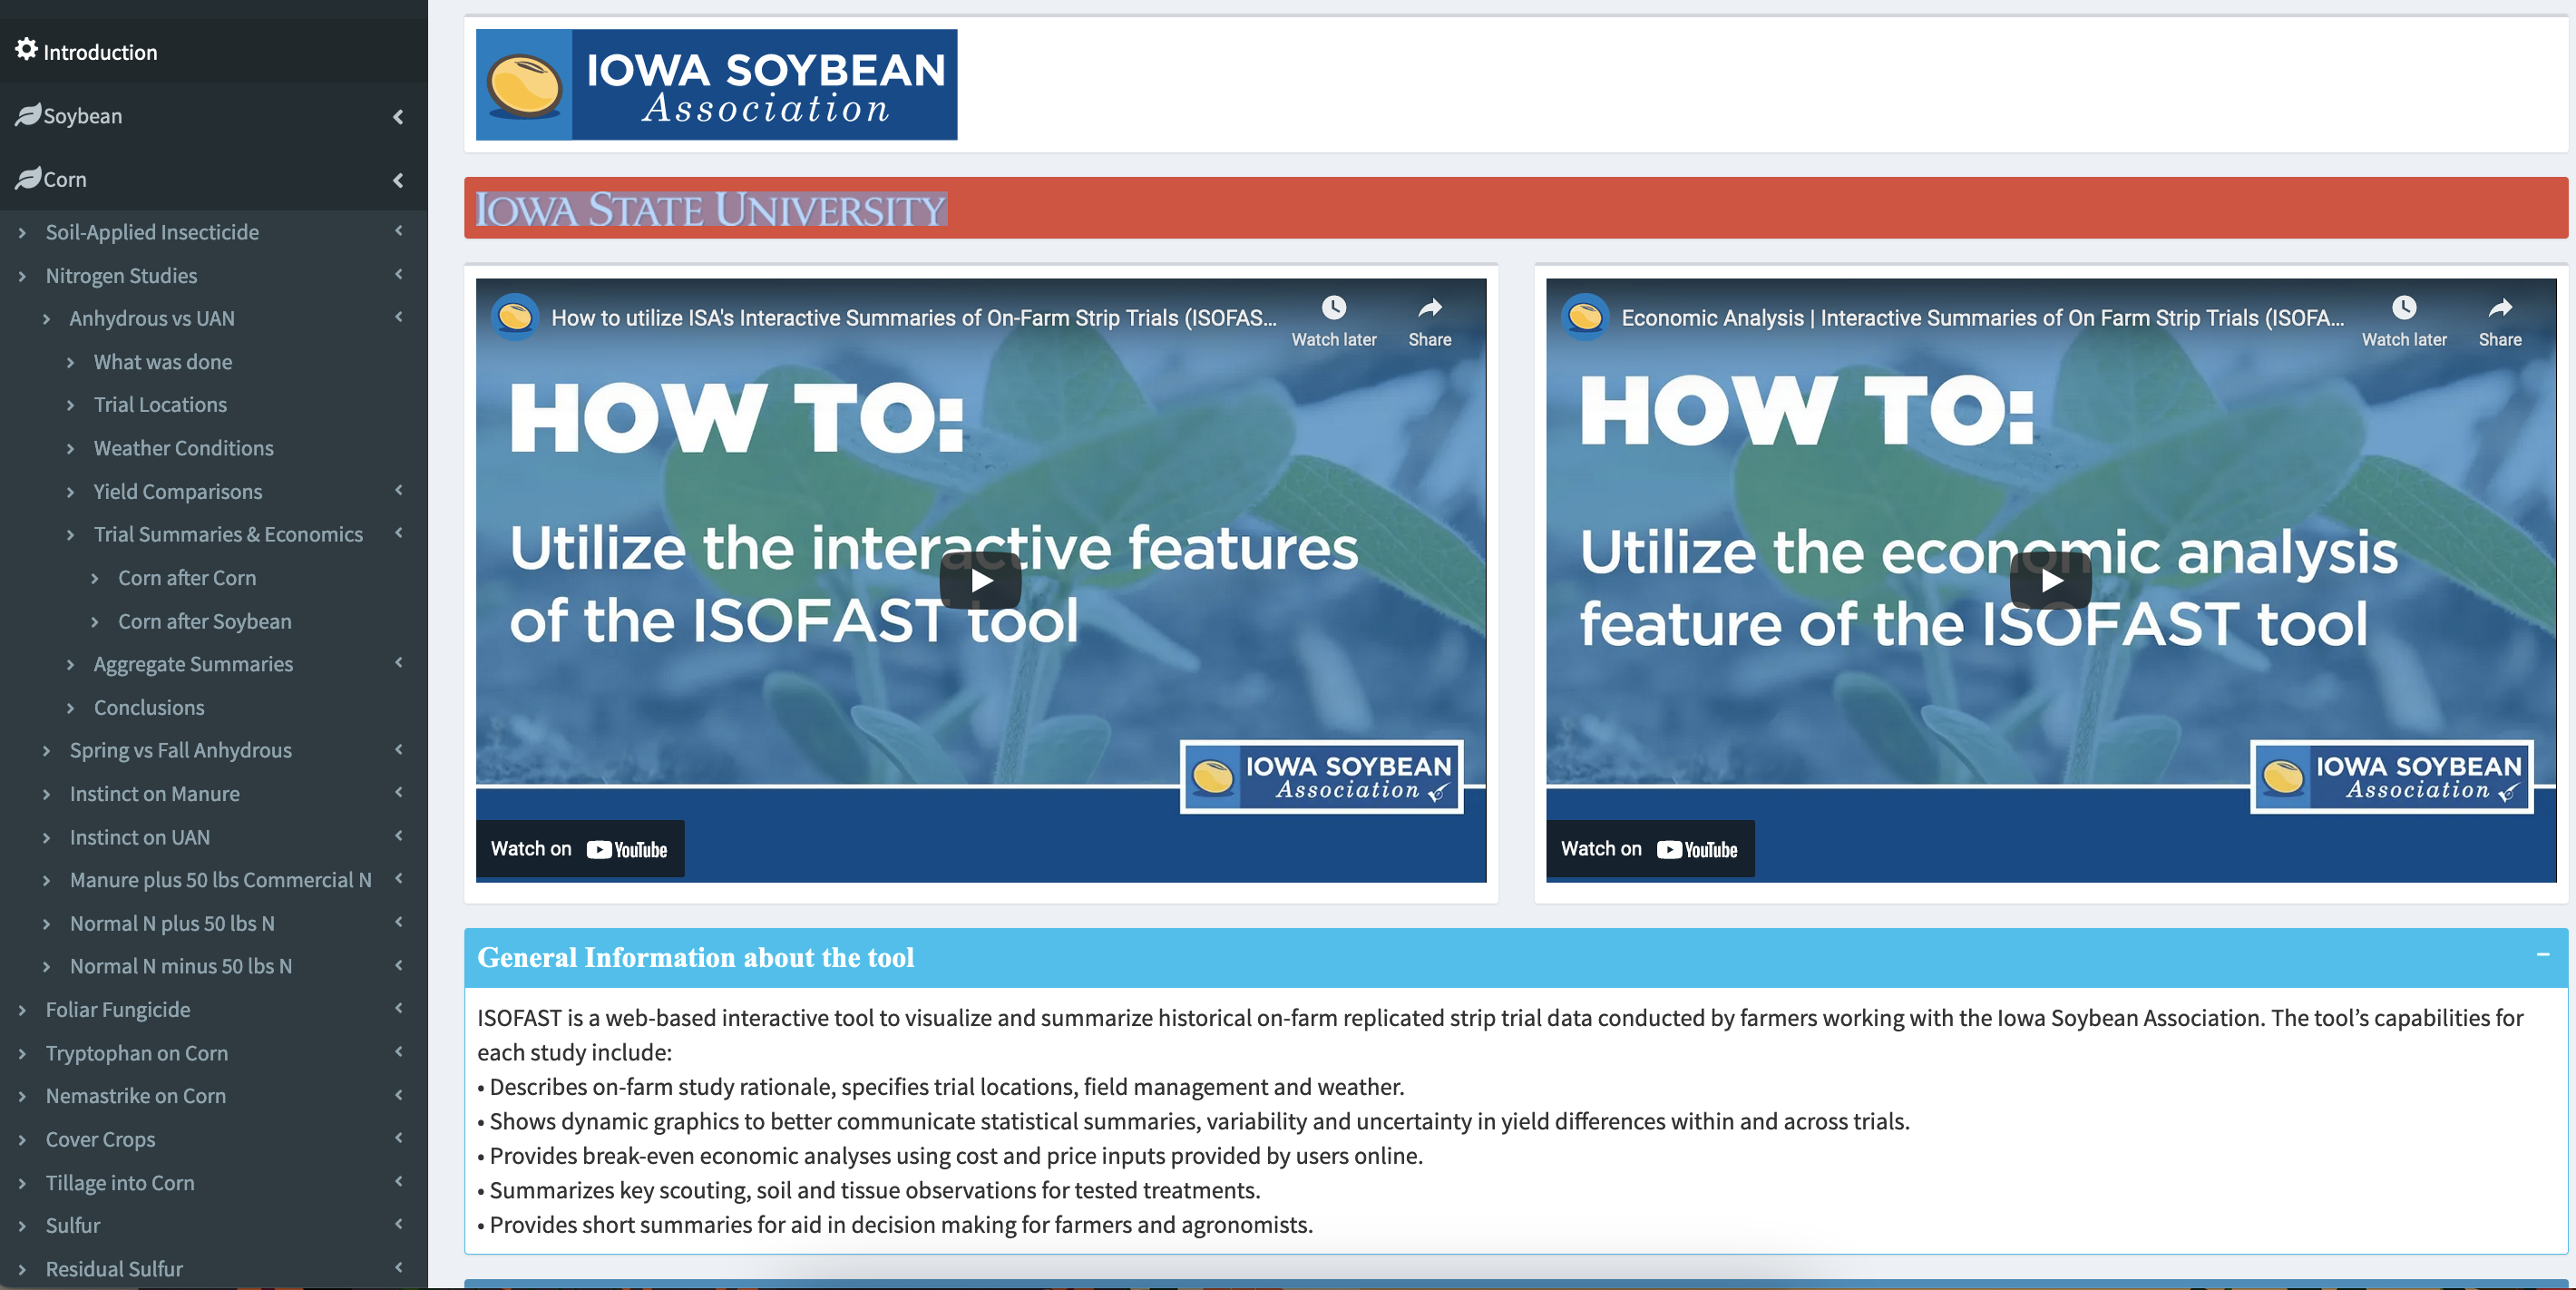
Visit our other web-application ISOFAST
ISOFAST, Interactive Summaries of On-Farm Strip Trials, is a web-based interactive tool to visualize and summarize historical on-farm replicated strip trial data conducted by farmers working with the Iowa Soybean Association.
To visit ISOFAST click here!
Contributors and Contact
ONFANT was created by Anabelle Laurent at Iowa State University using R Shiny.
For questions and feedback regarding ONFANT, please email alaurent@iastate.edu, femiguez@iastate.edu or pkyveryga@iasoybeans.com